TwinCAT 3 Scope Measurement

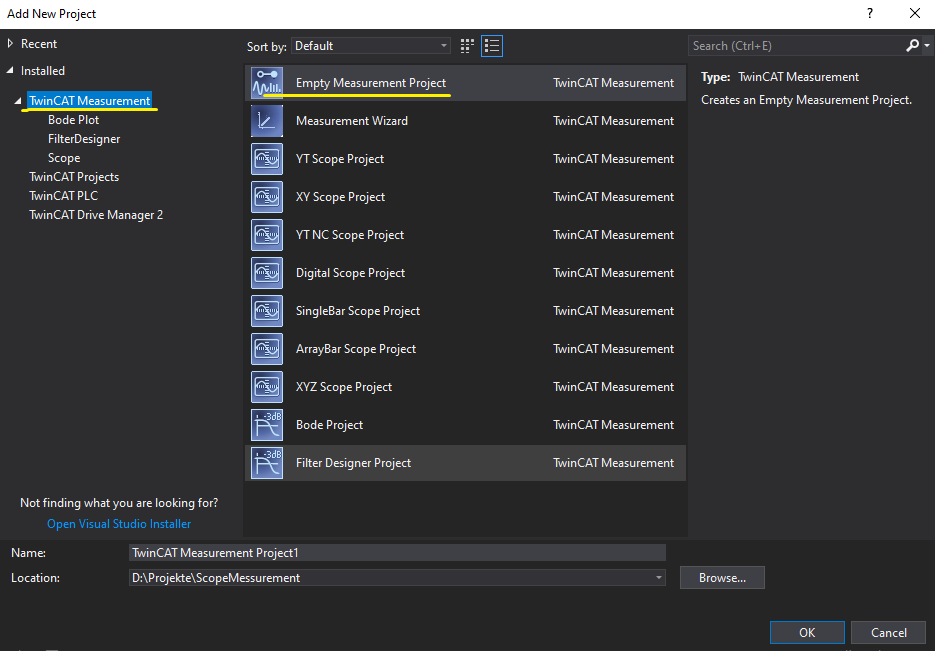
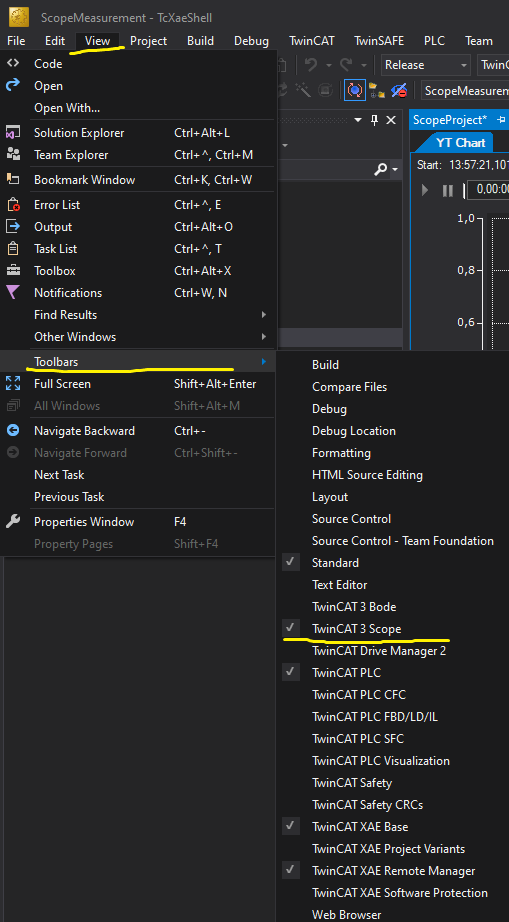
What is a scope measurement?

Do you know what an Oscilloscope is? Great, then you also know what a scope measurement is!

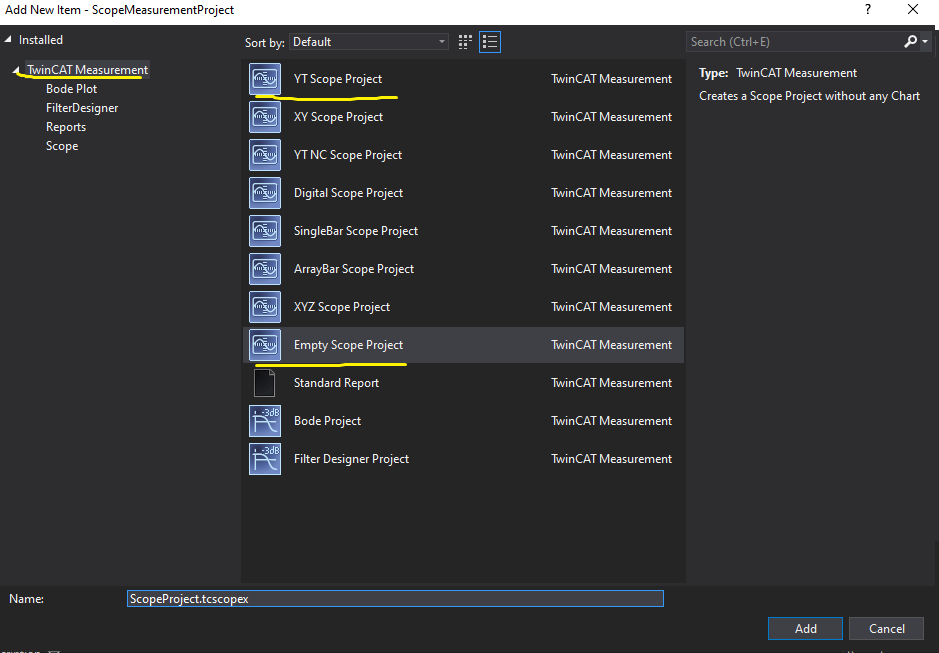
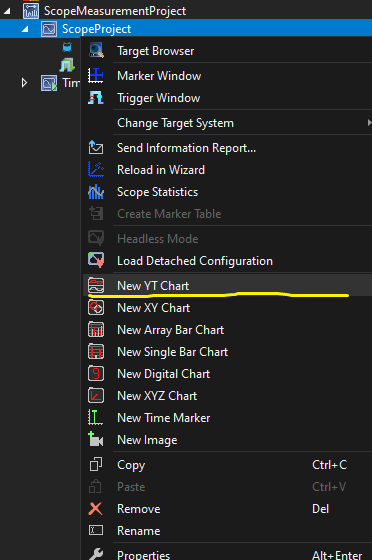
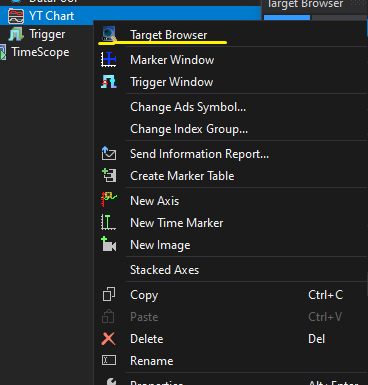
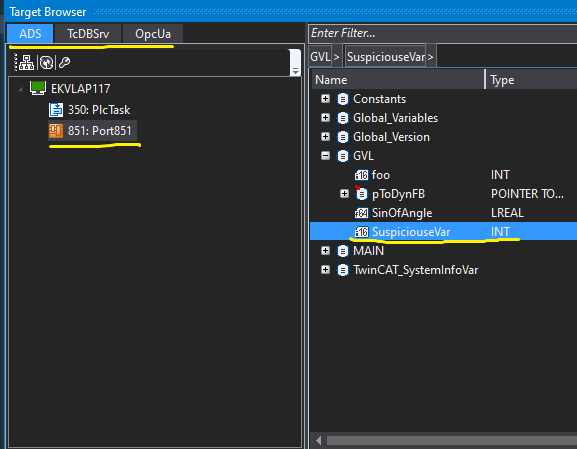
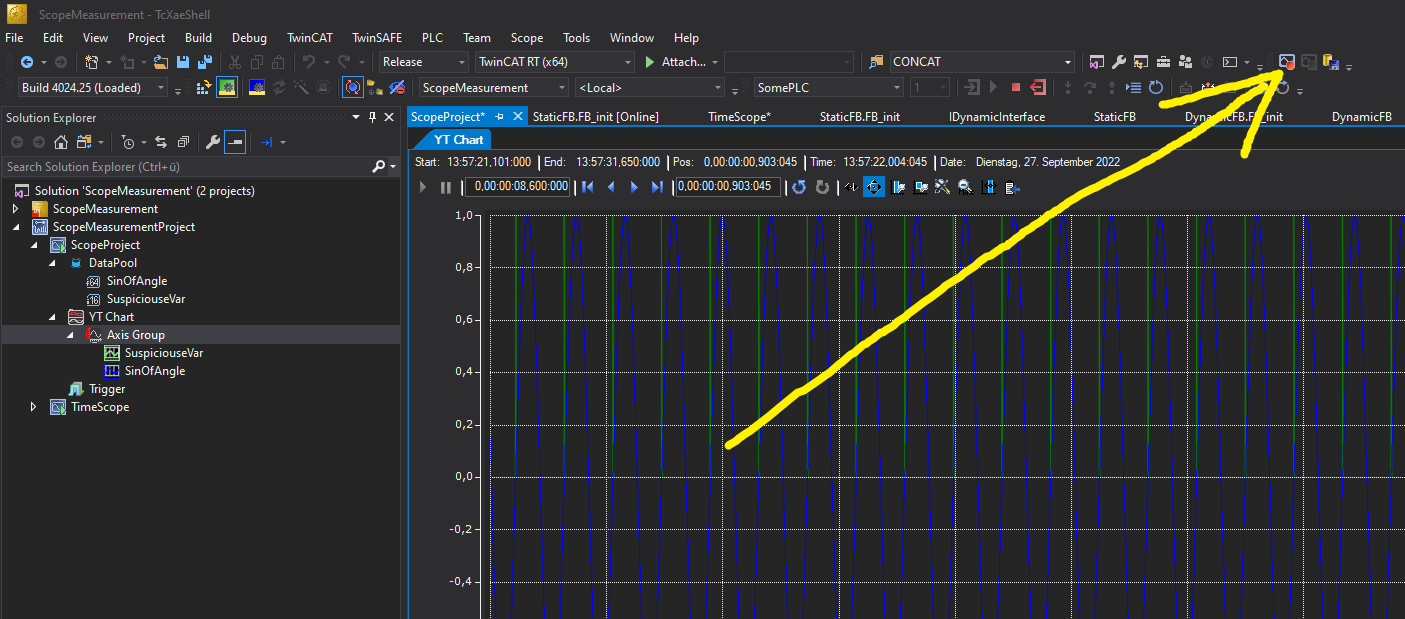
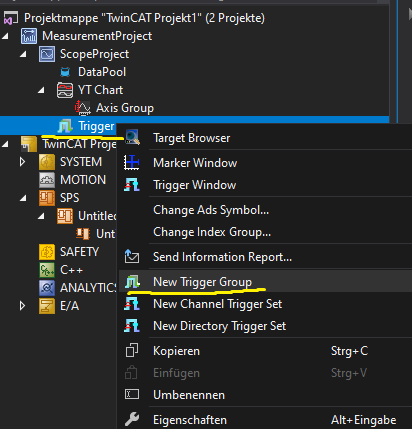
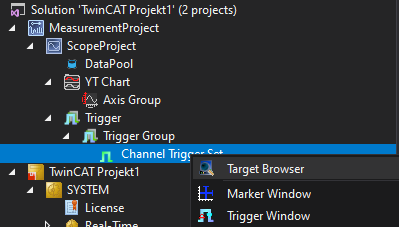
A scope measurement allows real-time data collection and visualization of simple data types (such as numbers, bool, etc.) from connected TwinCAT runtimes. The data can be displayed in various chart formats, such as YT charts for tracking changes over time or XY charts for comparing different data sets.

When and why you should use it?

Scope measurements are an excellent tool for visualizing fast-changing data and identifying sequence errors that occur in a short period of time. They are especially useful for detecting issues triggered by rapid events, such as releasing safety variables for actors. Additionally, scope measurements help uncover random errors that are difficult to pinpoint through logic alone. They are also valuable when breakpoints cannot or should not be used.

How to create a measurement project

1. Right-click on your solution and add a new project. (This does not need to be the solution for the project you want to measure!)

2. Add a new empty measurement project.

TwinCAT 3 Scope Measurement_01

3. You now have your measurement project ready to use in your solution.

TwinCAT 3 Scope Measurement_02

How to use it

Measure values over time

1. First, add a scope to your measurement project. You can choose to add a YT (Y over time) or an empty scope.

TwinCAT 3 Scope Measurement_03

2. If you started with an empty scope, add a new YT chart.

TwinCAT 3 Scope Measurement_04

3. Right-click on the chart and open the target browser. (Remember to rename the chart, to identify what you are measuring.)

TwinCAT 3 Scope Measurement_05

4. Select the project from which you want to access the value to be tracked (it must be running) and double-click the value in the right tree browser.

TwinCAT 3 Scope Measurement_06

5. If you want to track more variables, do a right click on the new axis group and add them with the target browser.

TwinCAT 3 Scope Measurement_07

6. You can start, stop and later save your recording in the TwinCAT menu bar.

TwinCAT 3 Scope Measurement_08

7. If you do not have this menu, you can easily add it: View->Toolbars->TwinCAT 3 Scope.

TwinCAT 3 Scope Measurement_09

8. You can now start measuring everything! If you want different charts (XY), create them instead and add the variables for the X and Y axis. If you have a lot of variables in a single chart and they do not overlap the way you want, you may want to try right-clicking and selecting stacked vars.

9. In addition, if you have already added a variable, it will be available in the scope’s data pool. If you want to track it in another chart, simply drag it from the data pool to the axis group.

Measurements of dynamic data (__new)

Unfortunately, you cannot measure the internal data of interfaces – only the value of the interface „pointer.“ However, you can measure the internal data of a POINTER TO FB. To do this, consider creating a GVL for your scope and adding the pointers to the FBs you want to track. Assign these pointers when creating your object with __new, and use them in the scope project. Make sure to commit beforehand, and if you’d like to preserve these measurements, create a new branch for them.

noun-information-6735183-FFFFFF_edited

Note: Technically, there can be no data within an interface. Therefore, TwinCAT cannot show you any information about it, because it does not exist at compile time.

Measurements of safety vars

To track variables in your safety project, send them via ADS to your PLC, and then access them as usual through a GVL.

Start on event / trigger

You do not want to wait for hours in front of a scope for that Heisenbug that you never seem to find? Then use triggers instead and go for a coffee break!

To add a trigger to your scope simply add a “New Trigger Group” under the node “Trigger”.

TwinCAT 3 Scope Measurement_10

The properties of the trigger group allow you to control what happens when the trigger occurs. The most interesting of these “Trigger Actions” are „Set Mark“, „Start Record“ and „Stop Record“. “Stop Record” also allows you to continue recording for a few seconds after the trigger is activated.

TwinCAT 3 Scope Measurement_11

To add your trigger conditions, right-click on the trigger group and add a new Channel trigger set. This is what you want to use most of the time.

TwinCAT 3 Scope Measurement_12

In the channel trigger group, you can search for the variables that you want to use as a trigger and add them to the group.

TwinCAT 3 Scope Measurement_13

For the channel and each trigger, you should configure whether they respond to a rising or falling edge, and set the corresponding threshold value. Additionally, specify whether the triggers are combined with OR (any var triggers the event) or AND (all vars must trigger within the same cycle for the event to occur).

TwinCAT 3 Scope Measurement_14

Markers

Markers can be a great tool to measure distances or time in a chart. To add a marker, just right-click on your axis Group and add a new marker (X,Y,T,…).

TwinCAT 3 Scope Measurement_15

You can configure the markers by clicking on them in the chart and editing the settings in the properties tab.

To make measurements, open the marker window in your scope.

TwinCAT 3 Scope Measurement_16
TwinCAT 3 Scope Measurement_17

More options for measurements

Instead of using scope measurements, you might opt for ADS log strings to obtain console outputs.

Additionally, the Scope-View offers many charts and features to explore. While most may not be necessary for your everyday work, if you encounter a problem, consult the documentation and experiment with the various charts to find potential solutions.